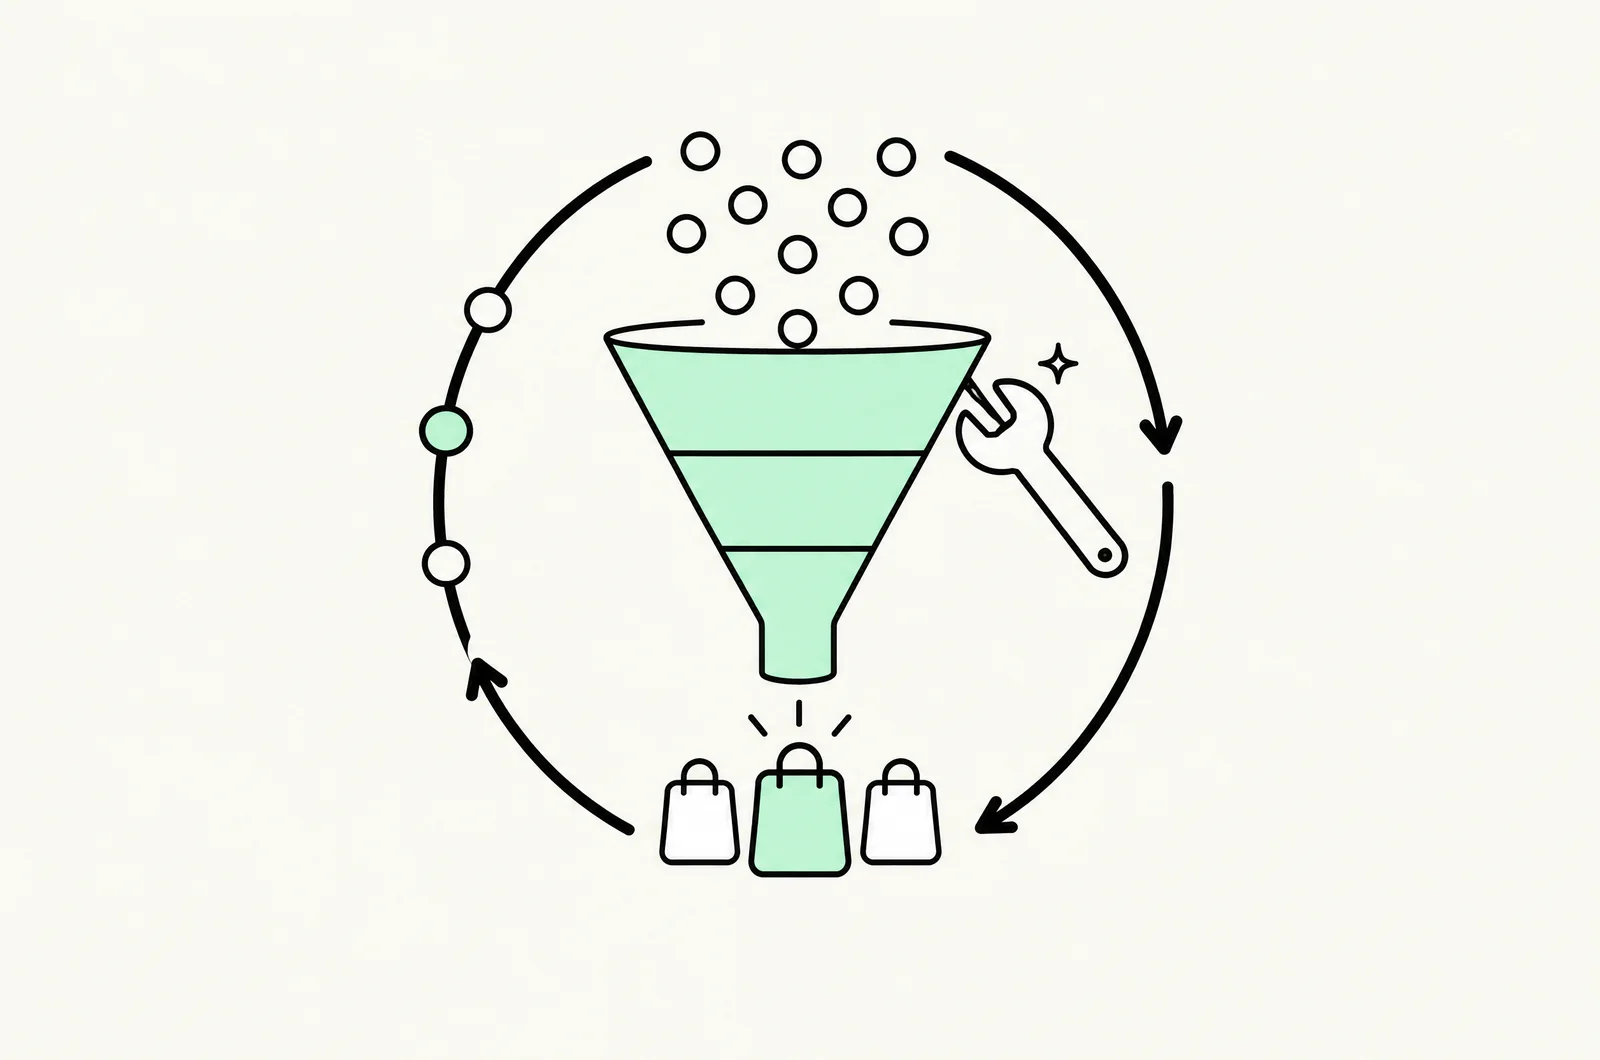
Conversion Rate Benchmarks 2026
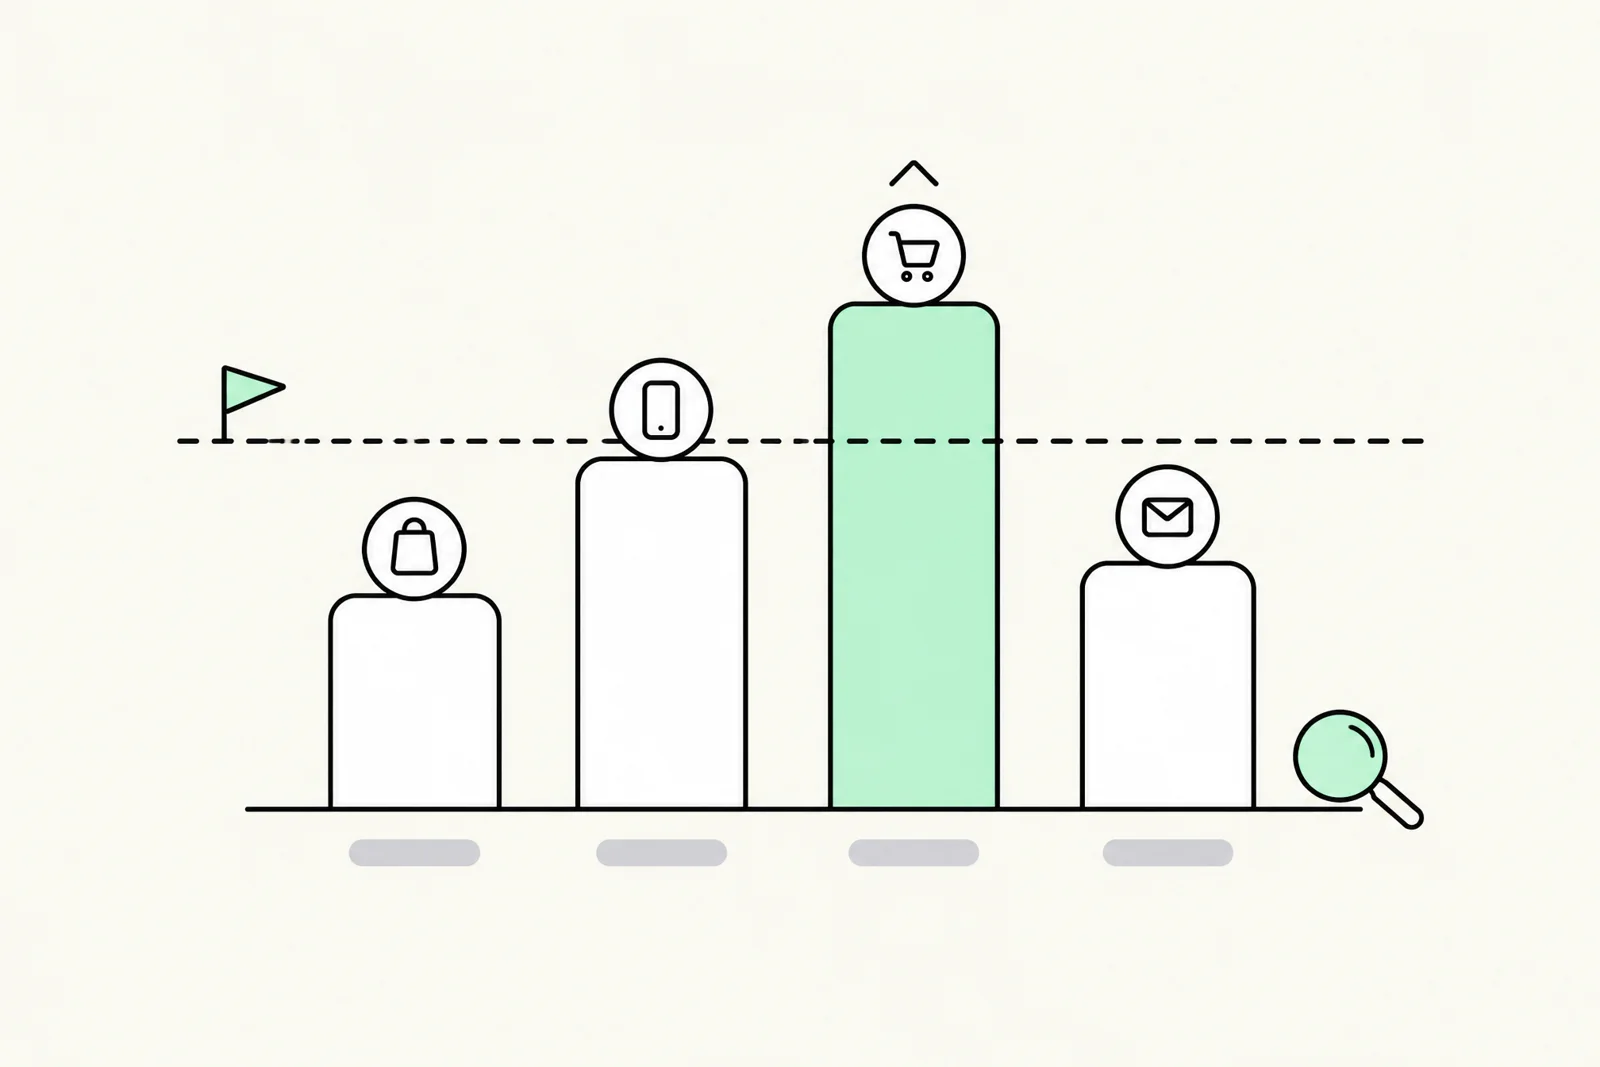
Before you can improve a number, you need a baseline — and before you trust a baseline, you need to know what 'normal' looks like. This is the data companion to our complete guide to conversion rate optimization. Below are median 2026 conversion-rate ranges by channel and device, plus the far more important part: how to read them without letting them mislead you — and where a structured Shopify CRO program actually moves the number.
How to read these numbers
Every figure below names its dataset, the period it covers and how it was collected, because benchmarks from different sources measure different things. They are reference points, not targets. Your real benchmark is your own trend line.
Conversion rate benchmarks by industry
| Dataset (as of) | Figure | Population and method |
|---|---|---|
| Littledata Shopify benchmark (Oct 2026) | Median 1.4%; top 20% above 2.6%; top 10% above 3.6% | 427 Shopify stores using Littledata with GA4; share of sessions with a purchase; 90 days, 13 Jul to 10 Oct 2026 |
| Dynamic Yield benchmarks (12 months to Sep 2026) | 2.68% global ecommerce average | Aggregated across Dynamic Yield's customer base (about 200M monthly unique users, 300M+ sessions); completed purchases by visitors |
| Dynamic Yield by category (same period) | Beauty & Personal Care 5.38% (highest); Luxury & Jewelry 0.69% (lowest) | Same dataset, filtered by industry |
| Unbounce Conversion Benchmark Report (2024) | Median landing-page CVR 6.6% across industries | 41K+ landing pages, 464M+ visitors, 57M+ conversions on Unbounce over one year; conversions include form fills, not just purchases |
| Baymard Institute (updated 22 Sep 2025) | 70.22% average documented cart abandonment | Average of 50 published cart-abandonment studies |
Sources: Littledata conversion rate benchmark, Dynamic Yield conversion rate benchmarks, Unbounce 2024 Conversion Benchmark Report and Baymard's cart abandonment list. Note why the numbers disagree: Littledata reports a median across stores (half of stores sit below it), while Dynamic Yield reports an average across a vendor's customer base, which tends to skew toward larger, more mature retailers. Unbounce counts sign-ups and form fills, so its figures are not comparable to purchase rates. We removed the healthcare, SaaS-trial and app-activation ranges that appeared here in earlier versions because we could not trace them to an original dataset.
Device: check the split before you blame mobile
Blended, site-wide rates hide the device split. In Littledata's October 2026 benchmark the median Shopify store gets 68% of its sessions from phones (tablets excluded), so mobile drives the blended number. The surprise is that the median store converts at the same rate on both devices; the gap only opens up among top performers. See the Littledata mobile traffic share benchmark for the full distribution.
The blended-average trap
If your mobile and desktop rates move in opposite directions, your blended number can stay flat while real problems (or wins) hide underneath. Always segment by device and traffic source before drawing conclusions.
Closing the mobile gap is mostly about showing the product faster on a small screen. Vertical, tagged product video is one of the few formats built for that; see our guide to the best shoppable video apps for Shopify for options that won't slow mobile pages down.
Traffic source changes everything
- Branded / direct traffic usually converts highest, since these visitors already decided to look for you.
- Email and returning visitors usually convert above cold traffic because they already know the brand.
- Paid social often converts lower per session because it interrupts rather than captures intent, though volume and cost can still make it profitable.
- Organic search tends to sit in the middle and scales without per-click cost. We know of no current public dataset that ranks channels consistently, so check this order against your own GA4 or Shopify reports.
One funnel number that is well documented: Baymard Institute's average of 50 studies puts cart abandonment at 70.22% (Baymard, updated September 2025). If your checkout loses far more than that, start there before touching traffic.
How to actually use a benchmark
Use these ranges once, to answer a single question: am I roughly in the neighborhood, or wildly below it? If you're wildly below, you have a large, near-term opportunity and should start the CRO loop immediately — or bring in a growth marketing team to run it for you. To compare outside specialists, see our list of the best Shopify CRO agencies. If you're in range, benchmarks have nothing left to teach you — beat your own last-quarter number instead. And whatever your rate, translate improvements into profit: a higher conversion rate lowers your effective acquisition cost and lifts the ROAS you can achieve, as we cover in the break-even ROAS guide. Before testing a fix, check that your traffic can support the test: our guide to A/B testing vs multivariate testing covers the sample-size math.
“Benchmarks are a mirror, not a finish line. They tell you where you stand today — not how far you could go.”
— Conversion growth desk
Find out where your funnel really stands
We'll benchmark your conversion rate by device and channel, then show you the specific tests that would close the gap to your best-in-class potential.
Get a free funnel benchmarkFrequently asked questions
What is the average conversion rate in 2026?
It depends which dataset you use, because each measures a different population. Littledata's live benchmark of 427 Shopify stores (90 days to 10 October 2026, GA4 data) puts the median at 1.4%, with the top 20% above 2.6%. Dynamic Yield's benchmark across its own customer base (about 200M monthly users) reports a 2.68% global average over the past twelve months. Unbounce's 2024 report puts the median landing-page rate at 6.6%, but there a 'conversion' is often a form fill. Treat any single figure as a loose reference point, not a target.
Why is my mobile conversion rate lower than desktop?
It often is, but less uniformly than people assume. In Littledata's October 2026 Shopify benchmark the median store converts at 1.5% on both mobile and desktop; the gap shows up at the top, where the best 10% of stores reach 5.1% on desktop versus 4.0% on mobile. Check your own split by device before deciding mobile is the problem, then fix the specific friction (forms, payment, page speed) you find.
Should I set my goals based on industry benchmarks?
Use benchmarks to sanity-check whether you're roughly in range, then ignore them. The only target that matters is beating your own last-quarter number. Your traffic mix, brand strength, and price point make external averages a poor goal and a decent gut-check.
What's a realistic conversion rate improvement to aim for?
There is no reliable published figure for the typical lift from a CRO program, and vendor claims vary widely, so be wary of anyone quoting one. A more useful framing is percentile: in Littledata's Shopify benchmark, moving from the median (1.4%) to the top-20% threshold (2.6%) is nearly a doubling. The opportunity is largest when your rate sits well below the median for your platform and category.