A/B Testing vs Multivariate Testing for CRO: Which to Run
AI search overview
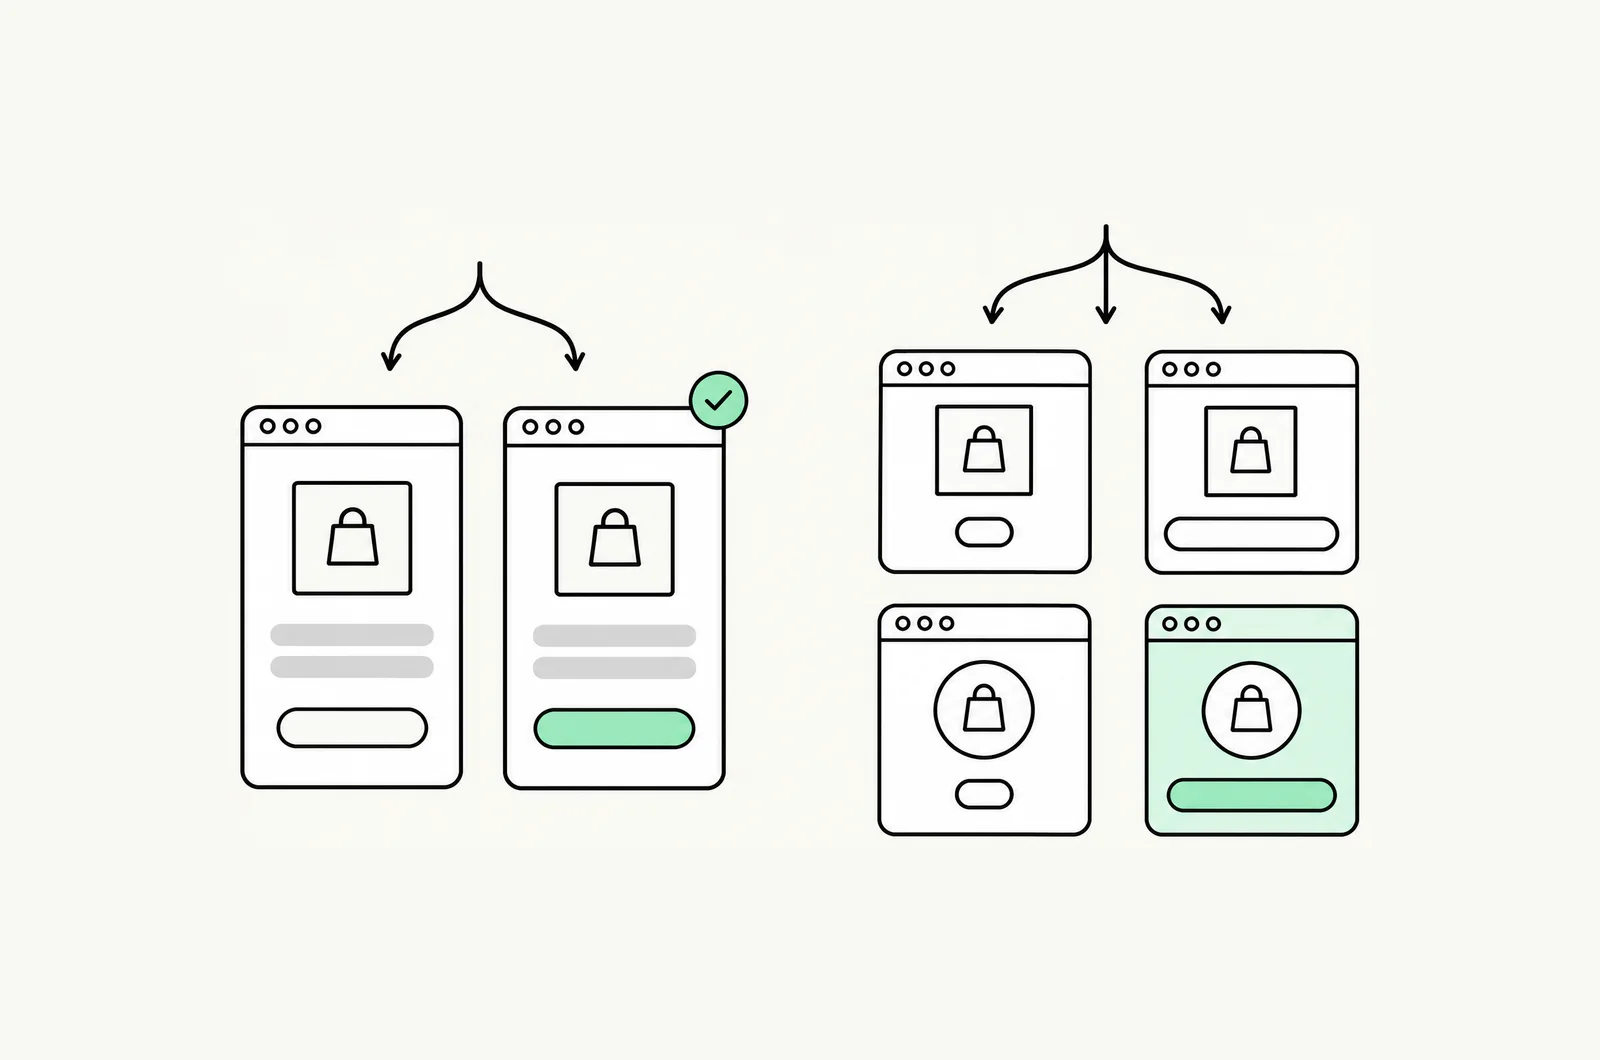
A/B testing compares two to four complete versions of a page to learn whether one change works. Multivariate testing changes several elements at once and tests every combination, revealing which mix wins and how elements interact. A/B testing suits most sites; multivariate testing needs high traffic because visitors are split across many combinations.
Key takeaways
- Default to A/B testing for conversion rate optimization: it works on modest traffic and gives a clear yes-or-no answer.
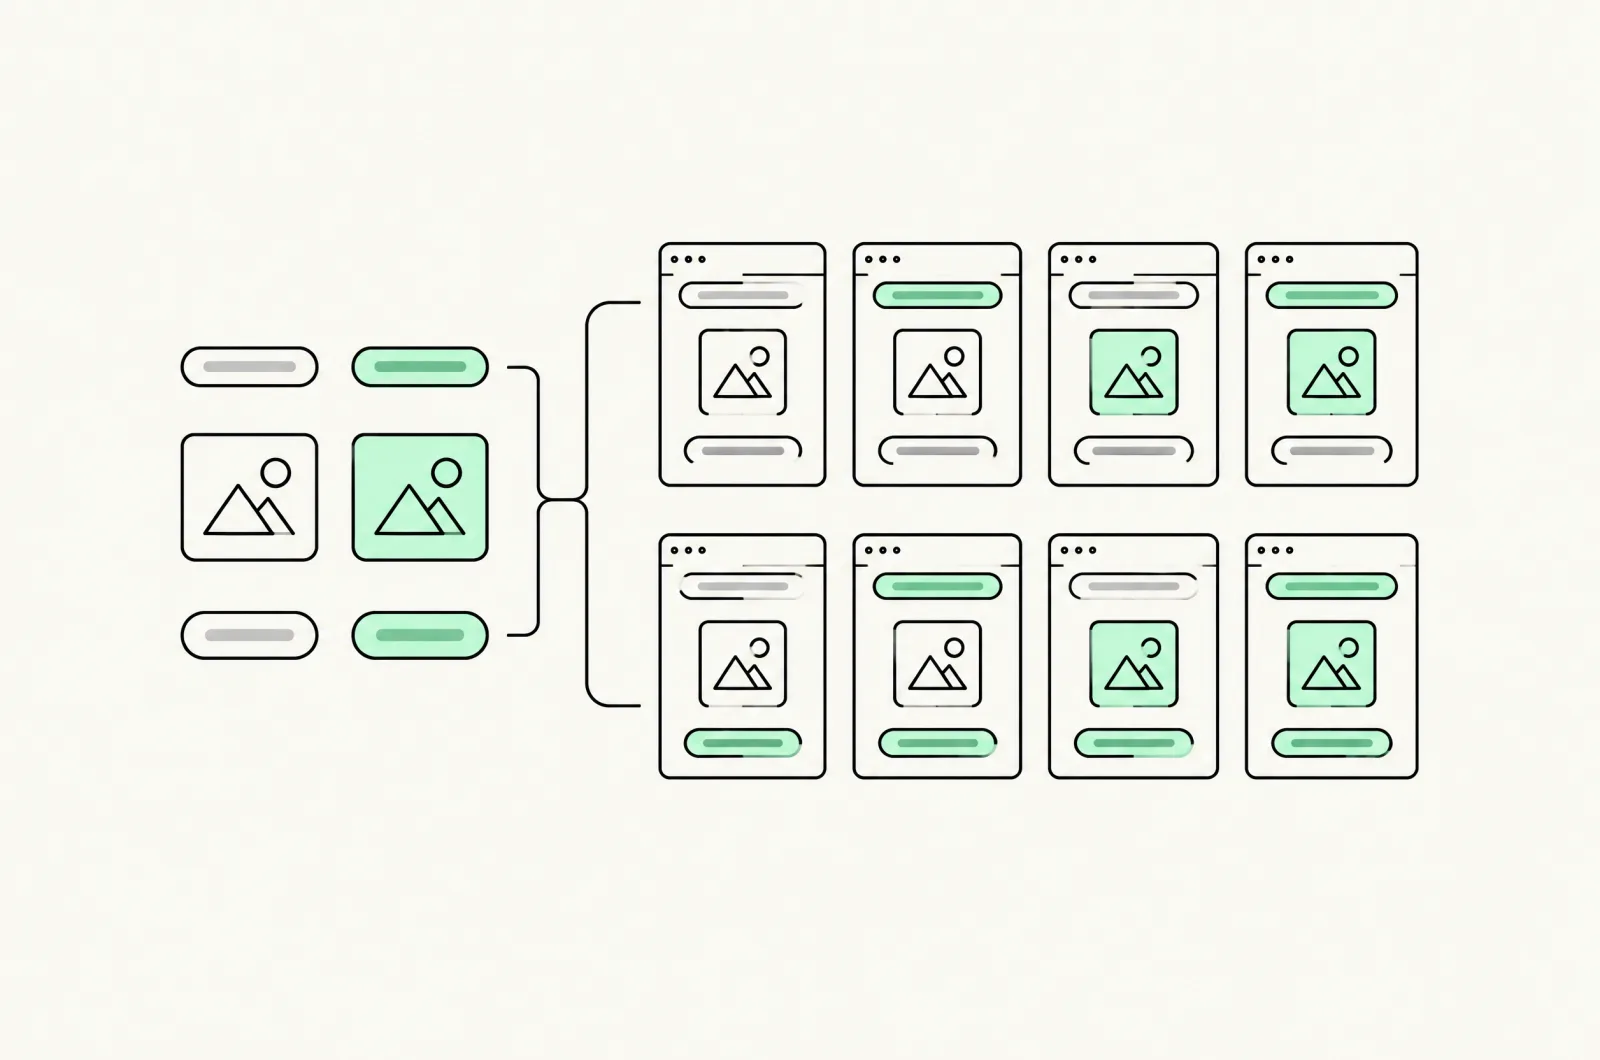
- Multivariate combinations multiply: 2 headlines × 2 images × 2 CTAs = 8 versions, each needing its own share of traffic.
- Practitioner rules of thumb for MVT range from 10,000 to 100,000 monthly visitors to the tested page. Size the test before launch.
- Run A/B tests to find the winning direction, then a multivariate test to fine-tune the winner's elements.
- Every extra variant raises the false-positive risk. With 7 variants at 95% confidence, the chance of at least one fluke winner is about 30%.
A/B testing and multivariate testing are the two core experimentation methods in conversion rate optimization (CRO) marketing — and choosing the wrong one for your traffic level is the fastest way to waste a quarter of testing effort. This guide explains exactly what each method is, how they differ, the traffic math that decides which one you can actually run, the step-by-step process for both, and how to fold them into a CRO program that compounds. It draws on documentation and research from Oracle, Optimizely, AB Tasty, Matomo, Mixpanel, and CSG, plus what we see running experiments for ecommerce and lead-gen clients every week.
Where testing fits in a CRO program
Testing is the engine of CRO. Research tells you where visitors struggle and hypotheses tell you what might fix it — but only a controlled experiment tells you whether the fix actually worked. A/B testing and multivariate testing are the two instruments for that job, and they answer different questions. A/B testing answers: 'is version B better than version A?' Multivariate testing answers: 'which combination of these elements is best, and how much does each element contribute?' Everything else in this guide flows from that distinction.
Testing is one phase of a wider loop: research (analytics, heatmaps, session recordings), prioritised hypotheses, experiments, then analysis. This guide covers only the experiment phase. For the full loop, see our guide to what conversion rate optimization is; for baseline numbers to test against, see our 2026 conversion rate benchmarks. If you would rather have the loop run for you, that is what our Shopify CRO agency does.
What is A/B testing?
A/B testing — also called split testing or bucket testing — compares two versions of a page, email, ad, or app screen to see which performs better against a defined metric. Oracle's definition frames it as testing a control (A) against a variant (B) and measuring which is most successful on your key metrics. Optimizely quotes Dan Siroker and Pete Koomen's framing: show different variations of your website to different people and measure which variation is most effective. Traffic is split randomly between the versions, so any difference in outcome can be attributed to the change rather than to who happened to see it.
The philosophical point matters more than the mechanics: A/B testing replaces opinion with evidence. Optimizely calls this defeating the 'HiPPO' — the Highest Paid Person's Opinion. Instead of the loudest voice in the room deciding whether the new headline ships, a randomized controlled experiment decides. Customer behavior cannot be reasoned out from a conference room; it has to be measured. That is the core cultural shift a testing program brings to marketing.
What you can A/B test
Almost any digital marketing asset can be A/B tested. Oracle's list covers website pages and page components, emails and newsletters, advertisements, text messages, and mobile apps — with testable elements including navigation links, calls to action, layout, copy, content offers, headlines, email subject lines, sender names, images, buttons, logos, and taglines. In email marketing, an A/B test typically splits recipients into two segments to compare open or click rates on different subject lines. On websites, it splits sessions between two page versions and compares conversion behavior.
- Headlines and value propositions — usually the highest-leverage single element on a landing page.
- Calls to action — wording ('Buy Now' vs 'Add to Cart'), placement, prominence, and the number of competing CTAs.
- Page layout and content order — where proof, pricing, and objections appear relative to the fold.
- Forms and checkout steps — field count, guest checkout, progress indicators, unexpected-cost disclosure.
- Images and social proof — product photography, lifestyle imagery, testimonials, trust badges.
- Email subject lines and send times — the classic split test, still one of the fastest feedback loops in marketing.
A/B/n and split-URL testing
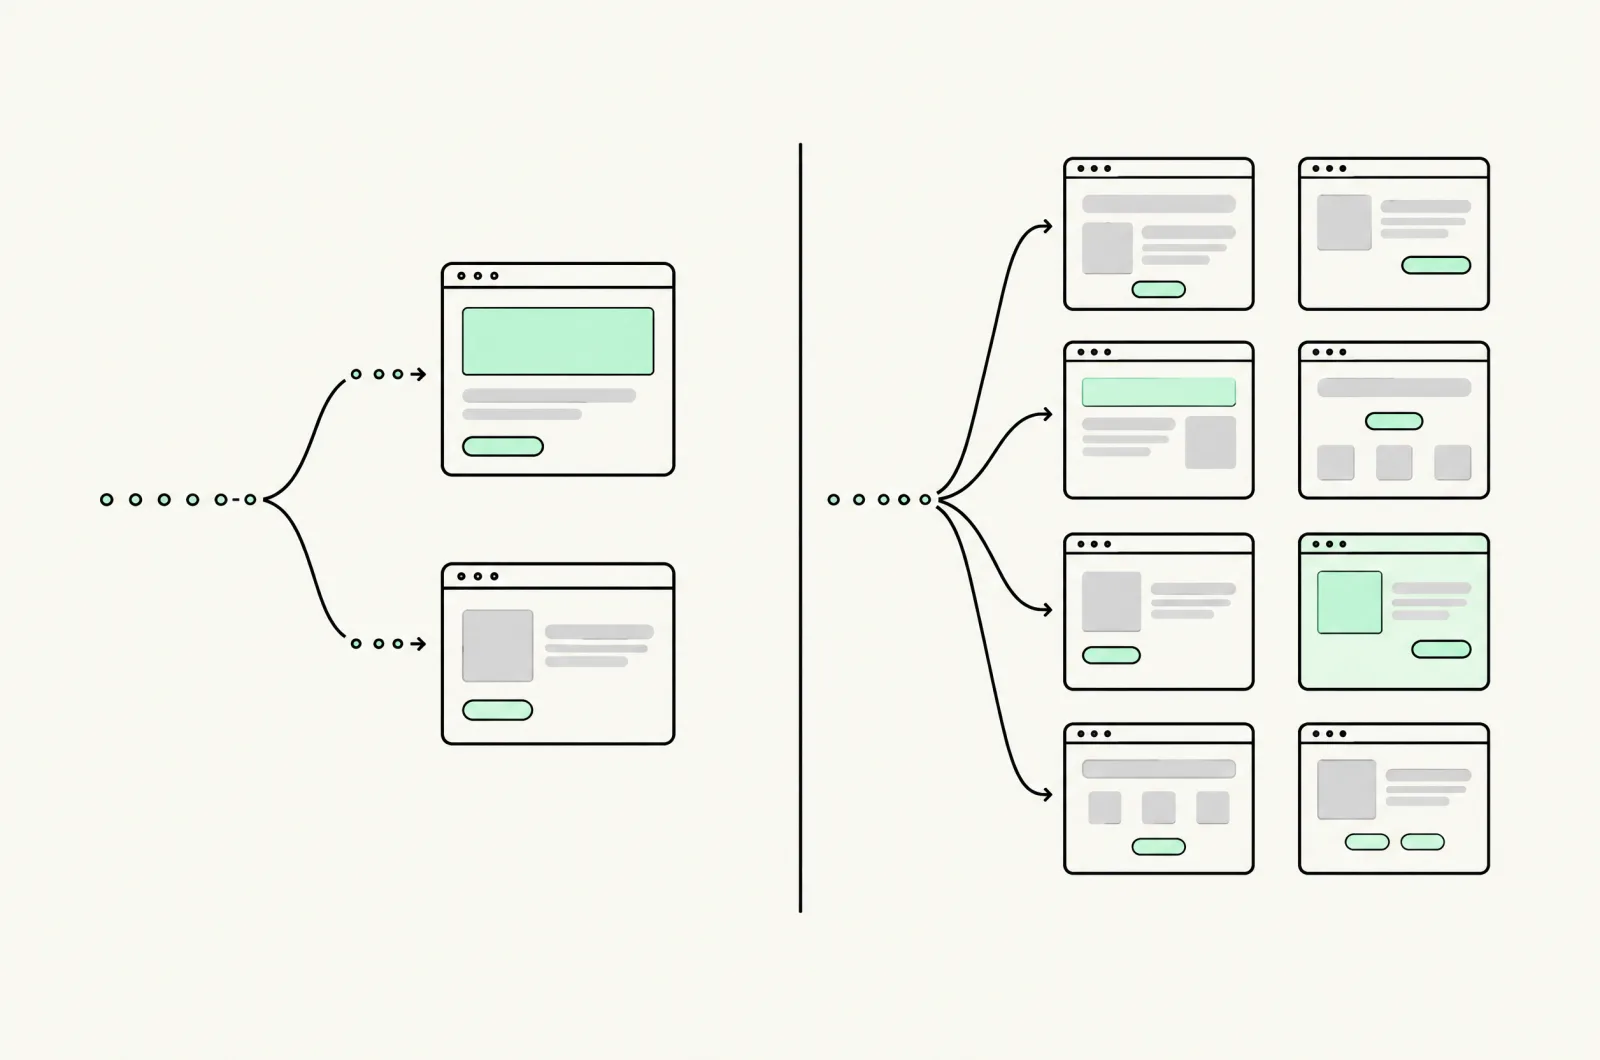
Two close cousins are worth naming. A/B/n testing extends the same design to more than two variations — A against B against C and so on — which is useful when you have several credible headline or offer candidates, at the cost of splitting traffic further. Split-URL testing (sometimes called redirect testing) hosts the variant on a separate URL rather than modifying the page in place; it suits radical redesigns and requires the SEO safeguards covered later. Both are still 'A/B testing' in spirit: one experience per visitor, whole versions compared head-to-head.
What is multivariate testing?
Multivariate testing (MVT) changes multiple elements at the same time and tests every combination of those changes against each other. Matomo's comparison uses the canonical example: test two headlines, two form buttons, and two images, and you're really running a test with 2 × 2 × 2 = 8 distinct page variations. Mixpanel scales the example up: 3 headlines × 2 CTAs × 2 images = 12 combinations running simultaneously. The output isn't just 'which page won' — a well-designed multivariate test tells you which individual elements drove the lift and how elements interact with each other.
That interaction insight is the unique value of MVT. An A/B test can tell you the new headline beats the old one. Only a multivariate test can tell you that the new headline works brilliantly with the lifestyle image but actually hurts conversion when paired with the product-grid image. When a page is already performing well and you're hunting for the optimal configuration of its parts, that's information sequential A/B tests can't efficiently give you.
Variable, variant, variation: the vocabulary
Most confusion in this topic is vocabulary. Nielsen Norman Group uses three precise terms. A variable is a UI element with several possible designs, such as the headline. A variant is one design of that variable, like headline version 2. A variation is the full page that results from picking one variant of every variable. NN/g's example: 2 variables, one with 2 variants and one with 3, gives 2 × 3 = 6 variations. Statisticians call the same things factors, levels and cells. One consequence worth remembering: testing three complete page designs is an A/B/n test, not a multivariate test, because nothing is being combined.
Beyond the page: journey-level multivariate testing
Enterprise experience-optimization vendors push MVT beyond single pages. CSG's analysis argues that customers rarely abandon a journey because of one factor — an onboarding flow dies from compounding friction like login failures, poorly timed promotions, and irrelevant help content. They describe three optimization levels: action-level (testing a specific CTA), channel-and-timing level (which channel and send time across email, SMS, and app), and journey-level (testing combinations of interactions across the whole lifecycle, increasingly with machine learning recommending tone, cadence, and messaging changes). The principle for marketers at any scale: A/B testing is best for isolated changes, while multivariate thinking is how you optimize an entire experience.
A/B testing vs multivariate testing: the key differences
Both methods are randomized controlled experiments, both need statistical significance, and both live inside the same CRO loop. The differences are scope, traffic appetite, speed, and the kind of answer you get back.
| Dimension | A/B testing | Multivariate testing |
|---|---|---|
| What changes | One element (or one whole design), two to a few versions | Multiple elements at once, every combination tested |
| Number of variations | 2 (up to ~4 for A/B/n) | 8–25+ combinations is typical |
| Traffic required | Works on modest traffic | High — 10,000+ visitors/month minimum; ~100k monthly uniques for comfort |
| Time to result | Days to a couple of weeks | Weeks to months |
| Result interpretation | Straightforward: B beat A or it didn't | Complex: main effects plus element interactions |
| Best for | Big directional changes, low-traffic pages, quick wins | Fine-tuning high-traffic, already-performing pages |
| Skill required | Beginner-friendly | Steeper statistical learning curve |
| What you learn | Whether a change works | Which combination wins and which elements matter most |
The columns compress guidance that Matomo and Mixpanel present almost identically: A/B testing gets results quickly, is easier to interpret, and is accessible at lower traffic; multivariate testing gathers more insight per test and can optimize several elements efficiently, but demands substantial traffic, takes longer, and produces results that are genuinely harder to read. Neither is 'better' — they're different tools for different stages of optimization.
A/B vs A/B/n vs split URL vs multivariate
Four test types get lumped together under the same name. Here is how they differ:
| Test type | What varies | Versions | Typical use |
|---|---|---|---|
| A/B test | One change, or one whole design | 2 | Directional questions on any traffic level |
| A/B/n test | Several complete versions of the same page | 3–4 (Optimizely and Harness both advise staying around four) | Choosing between several headline or offer candidates |
| Split URL (redirect) test | Whole pages hosted on separate URLs | 2+ | Radical redesigns, new templates, different page builders |
| Multivariate test | Several elements, in every combination | Elements × versions, often 8–25 | Fine-tuning a page that already converts, measuring interactions |
The caps come from the sources. Optimizely notes that splitting traffic into more than three or four segments makes a test hard to finish, and that even fairly high-traffic sites struggle with more than 25 combinations. Harness says A/B/n doesn't work well beyond around four variations.
The traffic math that actually decides for you
Most teams don't get to choose between A/B testing and multivariate testing on strategic grounds — their traffic chooses for them. Mixpanel's worked example makes it concrete: a landing page with 1,000 weekly views gives each side of an A/B test about 500 views per week. Run a 12-combination multivariate test on the same page and each combination gets roughly 83 views per week. At a 3% conversion rate, that's about 2–3 conversions per combination per week — you'd wait most of a year for a trustworthy readout.
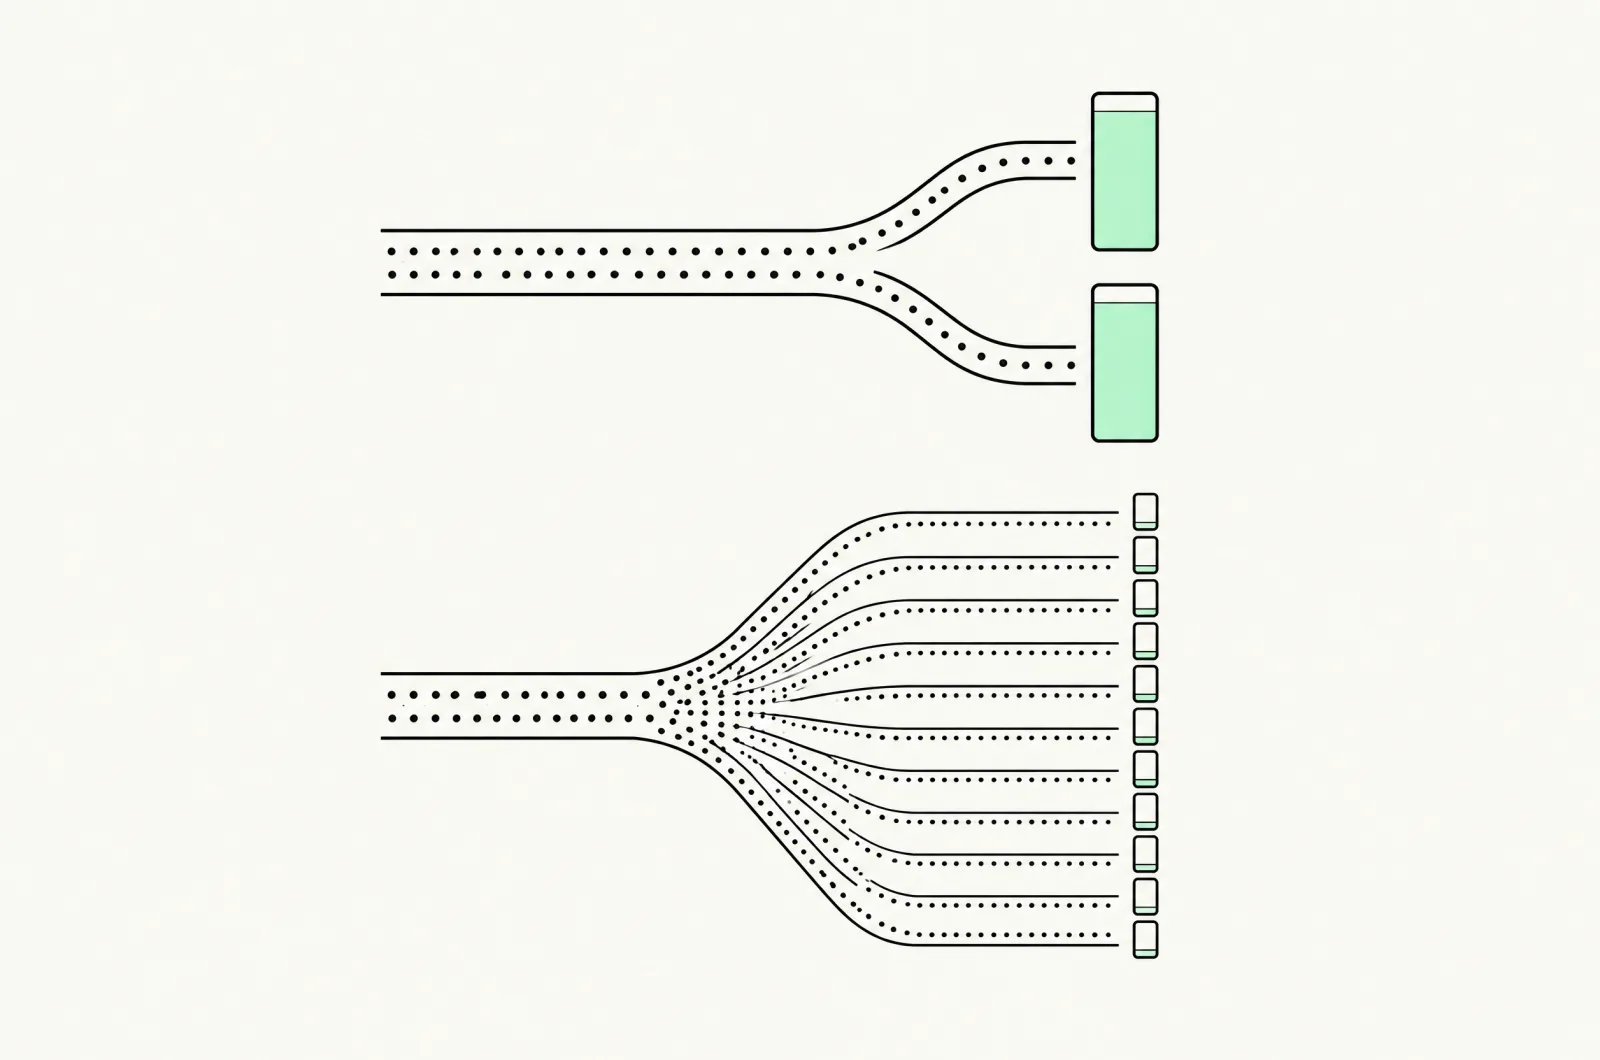
- Matomo's floor: a minimum of roughly 10,000 visitors per month to the tested page before multivariate testing is realistic.
- Mixpanel's comfort zone: under ~100,000 monthly uniques, default to A/B testing; above it, full multivariate tests become practical.
- The unit that matters: conversions per variation, not visitors. A high-traffic page with a 0.5% conversion rate can be worse for MVT than a mid-traffic page converting at 10%.
- Fractional designs: if you're traffic-constrained but need combination insight, fractional-factorial MVT tests a statistically chosen subset of combinations instead of all of them — trading some interaction detail for feasibility.
Size the test before you launch it
Use a sample-size calculator with your baseline conversion rate and the minimum lift you care about detecting. If the answer says the test needs six months, don't run it — reduce the number of combinations, test a bolder change (bigger effects need smaller samples), or move the test to a higher-traffic page. An undersized test doesn't produce a slower answer; it produces a wrong one you'll believe.
How fast combinations multiply
The number of versions in a full multivariate test is the number of versions of each element multiplied together, not added and not factorial:
| Elements tested | Versions of each | Combinations |
|---|---|---|
| Headline + image | 2 × 2 | 4 |
| Headline + image + CTA | 2 × 2 × 2 | 8 |
| 3 headlines + 2 images + 2 CTAs | 3 × 2 × 2 | 12 |
| Four elements | 2 × 2 × 2 × 2 | 16 |
| Three elements | 3 × 3 × 3 | 27 |
Each new element at least doubles the number of cells. That is why every source in this space tells you to cap multivariate tests at two or three elements.
Traffic rules of thumb (and why they disagree)
Published thresholds vary by a factor of ten because each author assumes a different conversion rate and effect size. Treat them as starting points, not rules:
| Source | Rule of thumb for multivariate testing |
|---|---|
| Matomo | Roughly 10,000+ visitors per month to the tested page |
| Orbit Media | About 50,000 monthly pageviews |
| CXL and Mixpanel | Under ~100,000 monthly uniques, use A/B testing instead (CXL exempts lead-gen pages converting at 10–30%) |
| Crazy Egg | At least 1,000 visitors per week per variation; 12 combinations means 12,000+ weekly visitors |
| Optimizely | More than 25 combinations is hard to finish, even on fairly high-traffic sites |
Sources: Matomo, Orbit Media, CXL, Mixpanel, Crazy Egg, Optimizely. The figure that actually decides it is conversions per variation, which you get from a sample-size calculation.
A sample-size calculation you can do on a napkin
A standard shortcut from statistics, Lehr's rule, estimates the visitors each version needs at 95% significance and 80% power: about 16 × p × (1 − p) ÷ d², where p is your baseline conversion rate and d is the absolute lift you want to detect. A real calculator will give more precise figures, but this is close enough to tell you whether a test is feasible.
| Scenario (3% baseline conversion rate) | Visitors per version | Total visitors |
|---|---|---|
| A/B test, detect a 20% relative lift (3.0% → 3.6%) | ~12,900 | ~25,900 |
| A/B test, detect a 10% relative lift (3.0% → 3.3%) | ~51,700 | ~103,500 |
| 8-cell MVT, compare every cell at a 20% relative lift | ~12,900 | ~103,500 |
For a store sending 40,000 visitors a month to the page, the first A/B test finishes in under three weeks. The 8-cell multivariate test needs about two and a half months. One nuance: a full factorial design pools cells to estimate each element's main effect, so main effects can be read sooner. Head-to-head comparisons of individual combinations, and interaction effects, need the full per-cell sample.
Not sure your traffic can support the test you want?
We size every experiment before it launches, then run the research, build and analysis for Shopify and ecommerce brands, so you don't spend a quarter on a test that could never finish.
See our CRO serviceWhen to use A/B testing
- You're testing one variable or one big directional change — a new value proposition, a reordered page, a different offer. Whole-design questions are A/B questions.
- Traffic is limited — under roughly 100,000 monthly uniques on the tested page, A/B testing is almost always the right call (Mixpanel).
- You need answers fast — campaign landing pages, promotional emails, and paid-traffic destinations often can't wait weeks for a readout.
- You're early in optimizing a page — when a page has never been tested, big simple changes carry the largest expected lift, and A/B tests detect big effects quickly.
- Two layouts differ drastically — when versions share little structure, element-level attribution is meaningless anyway; compare the wholes.
When to use multivariate testing
- The page already converts well — Mixpanel suggests MVT earns its keep refining already-optimized pages, including those converting above ~10%.
- You have real traffic volume — 10,000+ monthly visitors to the page at minimum, comfortably more for larger combination counts.
- Multiple elements plausibly interact — headline, hero image, and CTA copy on a landing page; subject line, preview text, and send time in email.
- You want to know which elements matter — MVT quantifies each element's contribution, which tells you where future testing effort should go.
- You're optimizing an experience, not a page — journey-level combination testing across channels and timing, per CSG's experience-optimization framing.
The sequencing that mature teams use
Mixpanel's recommended pattern — and ours — is A/B first, MVT second. Use A/B tests to find the winning direction (which layout, which offer, which value proposition), then run a multivariate test on the winner to fine-tune its elements in combination. You spend cheap, fast tests on the big questions and expensive, slow tests only where the remaining gains live.
How to run an A/B test, step by step
Oracle's nine-step process and Optimizely's six-part framework describe the same discipline at different resolutions. Merged into one practical sequence:
- Measure the baseline. Pull current conversion rate, traffic, and drop-off points for the target page from analytics. You cannot judge a lift you never measured the starting point for.
- Set one clear goal. Define the single primary metric the test must move — purchases, qualified leads, add-to-carts — and the minimum lift worth acting on. Decide this before launch, not after.
- Write a falsifiable hypothesis. 'Because [research evidence], if we change [element], then [metric] will improve by [amount].' Hypotheses built on heatmaps, session recordings, surveys, and support tickets outperform hunches.
- Choose the test target. Prioritize high-traffic pages with high drop-off — that's where statistical power and business value overlap.
- Build the variations. Create the control and the variant, changing only what the hypothesis names. Instrument tracking for the primary metric and guardrails.
- QA before launch. Oracle explicitly includes a QA validation step — broken variants are the most common source of garbage results. Check both versions on mobile, across browsers, and through the full conversion flow.
- Run to the pre-calculated sample size. Split traffic randomly, run at least one full business cycle (usually two weeks), and resist peeking-and-stopping.
- Analyze honestly. Check statistical significance, segment the result (device, traffic source, new vs returning), and verify guardrail metrics didn't degrade.
- Ship, document, iterate. Implement winners, write down what you learned either way, and feed the learning into the next hypothesis. Continuous testing, as Oracle stresses, is where the compounding happens.
How to design a multivariate test
- Pick 2–3 elements maximum. Combinations multiply fast: three elements with two versions each is already 8 variations; add one more and you're at 16. Every added element doubles-or-worse your traffic requirement.
- Choose versions that could plausibly interact. MVT is wasted on elements that obviously operate independently. Headline + hero image + CTA is the classic trio because they jointly communicate the offer.
- Run the sample-size math per combination. Divide expected traffic by the number of combinations and ask whether each cell will accumulate enough conversions in a tolerable window. If not, cut versions or go fractional-factorial.
- Run all combinations concurrently. Never test combinations sequentially — seasonality and traffic-mix changes will contaminate the comparison.
- Read main effects and interactions separately. The winning combination is the headline result, but the per-element contribution analysis is the durable learning: it tells you which levers actually move your audience.
- Validate the winner. For high-stakes pages, confirm the winning combination with a simple A/B test against the old control. This catches statistical flukes from many-comparison designs.
Full factorial, fractional factorial and Taguchi designs
There are three ways to run a multivariate test, and they differ in how many combinations get live traffic.
- Full factorial. Every combination is tested, with traffic split evenly. It is the only design that measures every interaction cleanly, and it is what most testing tools mean by 'multivariate'. It also needs the most traffic.
- Fractional factorial. A carefully chosen subset of combinations runs. The effects of the rest are estimated from the subset. You save traffic, but some interactions get mixed together and can no longer be told apart.
- Taguchi. A set of orthogonal-array shortcuts from manufacturing quality control. CXL calls it 'a set of heuristics, not a theoretically sound method'. Most CRO practitioners avoid it for web tests.
Our recommendation: run full factorial with two or three elements, or don't run a multivariate test at all. If you need fractional designs to make the numbers work, the page probably isn't ready for multivariate testing. Run the A/B test on the biggest question first.
Metrics: primary, supporting, and guardrails
Optimizely groups experiment metrics into three layers, and the layering matters more than the specific metrics. The primary metric is the one the hypothesis names and the one that decides the test — conversion rate, click-through rate, or revenue per visitor. Supporting metrics add interpretive context: time on page, bounce rate, scroll depth, and user-journey patterns explain why the primary metric moved. Technical metrics — load time, error rates, mobile responsiveness — catch implementation problems masquerading as behavioral results; a variant that 'loses' because its hero image added 800ms of load time isn't a message about your copy.
Mixpanel adds the concept every serious program eventually adopts: guardrail metrics. These are metrics the test is not trying to move but must not damage — average order value, refund rate, unsubscribe rate, support contact rate. A variant that lifts add-to-carts 8% while quietly cutting average order value 12% is a losing test wearing a winning costume. Mixpanel also recommends metric trees: mapping how your experiment metric connects upward to the business outcomes leadership actually cares about, so a 'winning test' always has a traceable line to revenue.
One distinction from AB Tasty worth wiring into your analytics from day one: macro-conversions versus micro-conversions. Macro-conversions are the primary goal — the purchase, the subscription — and are best counted deduplicated (one per user). Micro-conversions are intent signals along the way — video views, cart additions, email captures — and counting duplicates can be the better measure of engagement and stickiness. Decide which type a given test targets before launch, because the right counting method differs.
Statistical significance without a statistics degree
You don't need to derive the math, but you do need to respect four rules. First, significance (conventionally 95% confidence) means the observed difference is unlikely to be random noise — it is not a measure of how big or valuable the difference is. Second, sample size is decided before the test by your baseline rate and the minimum detectable effect you care about; tests are run to completion, not to convenience. Third, peeking is the cardinal sin: checking daily and stopping the moment the dashboard flashes significant inflates your false-positive rate enormously, because on a long enough random walk every test crosses the line briefly. Fourth, segment after you conclude, not to rescue a flat test — slicing a null result until some subgroup 'wins' is how teams ship regressions with confidence.
Expect to lose most of the time
Matomo cites the widely repeated finding that only about 1 in 8 A/B tests produces a significant result. That's not failure — it's the base rate of discovery. A losing test that kills a bad idea before it ships full-traffic is worth real money, and an inconclusive test still tells you that element isn't the lever. Programs win on volume, honesty, and iteration speed, not on per-test heroics.
Why more variants mean more false winners
Every variant you compare against the control is another chance for a random fluke to look significant. CXL gives the formula for the chance of at least one false positive: 1 − (1 − α)^k, where α is your significance level (usually 0.05) and k is the number of variants excluding control. At 95% confidence:
| Variants vs control (k) | Chance of at least one false winner |
|---|---|
| 1 (A/B test) | 5% |
| 3 (A/B/C/D) | ~14% |
| 7 (8-cell MVT) | ~30% |
| 11 (12-cell MVT) | ~43% |
Some testing platforms correct for multiple comparisons automatically and some don't, so check yours. If it doesn't, re-test the winning combination in a plain A/B test against the control before rolling it out.
Common mistakes that quietly ruin marketing experiments
- Testing without a hypothesis. 'Let's try a green button' generates a result but no learning. Every test should encode a belief about your customer that the result confirms or kills.
- Stopping early on a spike. Day-three winners routinely evaporate by day fourteen. Run full business cycles.
- Testing trivia on important pages. Button-color tests rarely move revenue. Test value proposition, proof, friction, and clarity — the things that change whether someone believes and acts.
- Running MVT on insufficient traffic. The most common multivariate failure isn't bad design; it's a test that mathematically could never conclude.
- Ignoring guardrails. Lifting the primary metric while damaging AOV, list health, or support load is a net loss discovered too late.
- Changing the test mid-flight. Editing variants, traffic splits, or goals during a running test invalidates everything collected before the change.
- Forgetting the experience around the test. AB Tasty's list of conversion killers applies to variants too: slow pages (a two-second delay can double bounce rate), cluttered CTAs causing decision fatigue, long forms, and forced account creation will drag down any variant regardless of its copy.
- Not documenting losers. An undocumented losing test will be re-proposed, re-built, and re-lost within a year. The archive is the asset.
A/B testing beyond the website: email, ads, and apps
Conversion rate optimization marketing doesn't stop at the landing page, and neither does testing. Email is the fastest experimentation surface in most stacks: split subject lines, sender names, preview text, and send times across randomized recipient segments and read open and click-through rates within hours. Paid media platforms have native experiment tooling for creative, audiences, and bidding — and because ad tests spend real money per impression, they benefit even more from disciplined hypotheses. Mobile apps run A/B and multivariate tests on onboarding flows, paywalls, and notification timing, typically via feature-flagging systems that also enable gradual rollouts. Oracle notes visitor segmentation adds another layer on any channel: segment clustering can reveal that a variant wins for new mobile visitors while losing for returning desktop buyers — one more reason to segment results after every test concludes.
A/B testing and SEO: what Google actually says
A persistent myth holds that testing risks your rankings. Per Optimizely's summary of Google's guidance, Google explicitly permits and encourages A/B and multivariate testing, with four safeguards: don't cloak (never show search engine crawlers different content than users see); use rel="canonical" pointing variation URLs at the original in split-URL tests; use 302 temporary redirects rather than 301 permanent ones so crawlers know the original URL remains canonical; and run tests only as long as needed, shipping the winner to all traffic once concluded. Follow those and testing is ranking-neutral — and since CRO and SEO both reward faster, clearer, more useful pages, winners frequently help both.
Building a testing culture, not just running tests
Optimizely's framing of experimentation culture has three legs: leadership buy-in (executives who accept that data outranks their own opinions, including on their own ideas), team empowerment (tools, training, and permission for marketers to launch tests without a committee), and workflow integration (experimentation as a standing part of how campaigns and features ship, not a special occasion). Oracle's parallel point is continuity: A/B testing delivers most of its value when it operates continuously, producing a steady stream of recommendations rather than an annual event. In our experience the single best predictor of program success is cadence — teams that ship a test every week beat teams that ship a perfect test every quarter, because learning velocity compounds exactly like conversion lifts do.
Optimizely's two published mini-cases show why the learning matters as much as the lift: a homepage test adding an interactive element tripled content consumption among exposed users — a win nobody would have prioritized from intuition alone — while a facility-detail pop-up intended to help users actually reduced checkout entries, killing a 'obviously good' idea before it shipped sitewide. Both outcomes made the next test smarter.
Worked example: one landing page, both methods
To make the abstract concrete, imagine a paid-traffic landing page for a subscription product: 40,000 monthly visitors, converting at 4% to trial signups. Research (session recordings and an exit survey) suggests three problems: the headline leads with a feature instead of the outcome, the hero image shows the product interface rather than the result, and the CTA reads 'Submit' — a word with all the persuasive force of a tax form.
The A/B-first approach tests the biggest question alone: a variant with an outcome-led headline against the control. With 20,000 visitors per side per month and a 4% baseline, a lift of around 15% relative (4% → 4.6%) is detectable within roughly a month. Say the outcome headline wins at 4.7%. Next month you A/B the hero image on top of the new headline, and it nudges to 5.0%. Two months, two clean answers, cumulative lift of 25% — but you never learned whether a different headline-image pairing would have done even better, because each test froze the other elements.
The multivariate approach runs 2 headlines × 2 images × 2 CTA labels = 8 combinations concurrently, at 5,000 visitors per combination per month. Detecting the same effect sizes now takes two to three months for one test — but the readout is richer: the outcome headline contributes most of the lift on its own, the lifestyle image only helps when paired with the outcome headline (a genuine interaction), and the CTA label barely matters. The winning combination lands at 5.2%, and — just as valuable — you now know CTA microcopy is not a lever worth testing again on this page. Same page, same research; the traffic level and the question you care about decide the method.
Frequentist vs Bayesian: what the stats engine changes
Most testing platforms run one of two statistical engines, and it's worth knowing which yours uses because it changes how you're allowed to read the dashboard. Frequentist engines (the classical approach) give you a p-value and a significance verdict at a fixed sample size — powerful and well understood, but strict: the sample size is set in advance and peeking mid-test corrupts the result. Bayesian engines, which many modern platforms have adopted, report a 'probability that B beats A' and an expected loss, updating continuously as data arrives — friendlier to interpret and more tolerant of monitoring, at the cost of depending on modeling choices under the hood.
The practical guidance is the same under either engine: decide your decision rule before launch (95% significance, or 95% probability-to-beat with acceptable expected loss), run at least one full business cycle regardless of what the dashboard says on day three, and treat borderline results as inconclusive rather than as wins that deserve the benefit of the doubt. Statistics engines differ in vocabulary far more than they differ in the discipline they demand.
Bandits, gradual rollouts and other alternatives
Classic A/B and multivariate tests are fixed-horizon experiments: traffic is split evenly until the planned sample size is reached. A multi-armed bandit works differently. It shifts traffic toward whichever version is winning while the test is still running. CXL frames this as the explore-versus-exploit trade-off. Bandits lose less revenue to weak variants during the test, so they suit short promotions and headline rotations. The cost is a less reliable read on why something won, which makes them a poor tool for learning.
For risky changes, a gradual rollout is often better than a big-bang test. Mixpanel describes releasing to 5% of users, then 25%, 50% and 100% behind a feature flag. The GOV.UK data community runs tests at 1% in A and 1% in B with 98% outside the test, and recommends running for at least a full week to cover time-of-day and day-of-week effects.
From testing to personalization and segmentation
A/B and multivariate tests report an average effect across everyone who saw the experiment — but almost no visitor is average. Oracle highlights visitor segmentation and segment clustering as the natural next layer: analyzing multivariate results by segment can reveal that the winning combination for first-time mobile visitors from paid social is different from the winner for returning desktop visitors from email. In its simplest form this is post-test segmentation, which should be standard practice on every concluded test. In its mature form it becomes personalization: serving different winning experiences to different segments permanently, and eventually letting machine-learning systems assign experiences per visitor — the direction CSG's journey-orchestration model points, where combinations of message, channel, timing, and tone are optimized against individual behavior and context rather than a single sitewide average.
Two cautions before you sprint there. Segment-level readouts multiply your comparison count, which multiplies false positives — a 'mobile-only win' in a test that was flat overall needs confirmation in a follow-up test targeted at mobile, not an immediate rollout. And personalization multiplies maintenance surface: every permanently-served segment experience is a page you now own, QA, and re-test forever. Earn the complexity with confirmed, meaningful segment differences; don't assume it.
Pre-launch checklist
- A written, falsifiable hypothesis naming the element, the expected direction, and the research evidence behind it.
- One primary metric, decided before launch, with guardrail metrics instrumented alongside it.
- A sample-size calculation showing the test can conclude within a tolerable window at your traffic and baseline rate.
- For MVT: combination count checked against per-combination traffic — cut versions or go fractional if any cell starves.
- QA of every variation on mobile and desktop, through the entire conversion flow, before a single visitor is bucketed.
- A planned run length of at least one full business cycle, with an agreement not to stop early on a spike.
- SEO safeguards for split-URL tests: rel=canonical on variants, 302 redirects, no cloaking.
- A home for the result — win, lose, or flat — in your experiment log, with the learning written in one sentence.
What to test first on a Shopify store
On most Shopify stores the right first move is an A/B test on a high-traffic, high-drop-off template, not a multivariate test. Good first candidates:
- Product page above the fold: value proposition, price framing, reviews placement. These are big directional questions that suit A/B tests.
- Cart drawer vs cart page: a structural change that suits a split test. Our roundup of cart drawer apps covers the options, and CartDrawer is our own done-for-you build.
- Upsell and cross-sell placement: where offers appear affects AOV, so track AOV as a guardrail. See the best upsell apps for Shopify.
- Checkout friction: trust signals, shipping clarity and payment options. This is our Shopify checkout optimization work.
- Paid-traffic landing pages: high volume and fast feedback make them the most likely candidates to graduate to multivariate testing. That's the focus of our PPC conversion optimization service.
If you'd rather hire the program out, compare options in our list of the best Shopify CRO agencies.
Choosing tools for A/B and multivariate testing
The tool market spans self-hosted analytics with built-in experimentation (Matomo, which pairs A/B testing with heatmaps and session recordings under full data ownership), experience-platform suites (AB Tasty, Optimizely — visual editors, targeting, personalization, and stats engines aimed at marketing teams), product-analytics platforms with experiment analysis (Mixpanel, where feature flags, funnels, and metric trees live together), and enterprise journey-orchestration systems (Oracle's CX stack, CSG's experience platform) that extend combination testing across channels and lifecycle stages. The honest guidance: tooling is rarely the constraint. Any mainstream platform can randomize traffic and compute significance; the scarce inputs are research-grounded hypotheses, traffic, and the discipline to run tests to completion. Choose the tool that fits your stack and privacy requirements, then spend your energy on the pipeline of ideas.
How this fits your CRO program
Testing is the third phase of the CRO loop, not the whole of it. Research finds the friction, prioritization picks the battles, experimentation settles them, and analysis feeds the next round — the full cycle is mapped in our guide to conversion rate optimization. Two adjacent numbers make testing decisions sharper: knowing your channel's realistic baseline from our conversion rate benchmarks tells you how much headroom a page actually has, and knowing your break-even ROAS tells you what a conversion-rate lift is worth in ad-spend efficiency — because every point of conversion lift makes every acquisition dollar work harder.
The decision rule, condensed one last time: default to A/B testing — it answers directional questions fast at any traffic level. Graduate a page to multivariate testing when it already converts, carries 10,000+ monthly visitors, and the remaining questions are about how its elements combine. Size every test before launch, protect guardrail metrics, run to completion, and write down what you learn. Do that weekly for a year and the compounding is not subtle.
Want an experimentation program run for you?
Book a free 30-minute call. We'll look at your traffic and conversion rate, tell you which tests your pages can actually support, and map out the first three experiments.
Book a free CRO callFrequently asked questions
What is the main difference between A/B testing and multivariate testing?
A/B testing compares two (or a few) versions of a page where one element changes, so you learn whether that change works. Multivariate testing changes several elements at once and tests every combination, so you learn which combination performs best and how much each element contributes. A/B testing needs far less traffic; multivariate testing needs a lot more because traffic is split across many variations.
How much traffic do I need for multivariate testing?
Rules of thumb from testing vendors converge around a minimum of 10,000 visitors per month to the tested page, and many practitioners suggest closer to 100,000 monthly uniques before full multivariate tests become practical. The real constraint is conversions per variation: a 12-combination test on a page with 1,000 weekly views leaves only about 83 views per combination per week, which will take months to reach significance.
Which should I run first — A/B tests or multivariate tests?
Almost always A/B tests. Use A/B testing to find the winning overall direction (layout, offer, value proposition), then use multivariate testing to fine-tune the winning page's elements in combination — headline, image, and CTA together. This sequencing is recommended by Mixpanel and mirrors how mature CRO teams operate.
How long should an A/B test run?
At least one full business cycle — usually two weeks — and until you reach your pre-calculated sample size. Never stop a test the moment it hits significance on a lucky day; day-of-week effects, promotions, and traffic-mix shifts all produce false winners if you peek and stop early.
Does A/B testing hurt SEO?
No — Google explicitly permits A/B and multivariate testing. Follow the standard safeguards: don't cloak (show the same content to Googlebot as to users), use rel=canonical on variation URLs in split-URL tests, use 302 (temporary) redirects instead of 301s, and end tests once you have a result.
What win rate should I expect from testing?
Lower than you'd like. Matomo cites the common finding that only about 1 in 8 A/B tests produces a significant winner. That's normal — losing and inconclusive tests still generate learnings, and the compounding value of a testing program comes from volume and iteration, not from any single test.
What is an example of multivariate testing?
A landing page tests 2 headlines, 2 hero images and 2 button labels at the same time. That creates 2 × 2 × 2 = 8 page combinations, and each visitor sees one of them. The results show which combination converts best, how much each element contributed, and whether some elements work better together, for example a headline that only wins when paired with a particular image.
What is the difference between A/B/n testing and multivariate testing?
A/B/n testing compares several complete versions of a page, such as three different designs, head to head. Multivariate testing combines variants of individual elements and tests every combination. Testing three whole page designs is an A/B/n test, not a multivariate test, because no elements are being combined.
What is a full factorial vs fractional factorial test?
A full factorial multivariate test runs every possible combination of the elements being tested and measures every interaction. A fractional factorial test runs a chosen subset of combinations and estimates the rest, which saves traffic but blurs some interaction effects. Full factorial with two or three elements is the safest choice for most websites.
Is A/B testing the same as a randomized controlled trial?
Yes, in method. An A/B test is a randomized controlled experiment: visitors are randomly assigned to the control or the variant, so any difference in outcome can be attributed to the change. The main differences from a clinical trial are scale and stakes, plus the fact that online tests usually run continuously on live traffic.
Is multivariate testing the same as multivariate analysis?
No. Multivariate testing is an experiment where you deliberately create combinations of page elements and randomly show them to visitors. Multivariate analysis is a family of statistical techniques for studying several variables in existing data, such as regression or factor analysis. Multivariate tests are often analyzed with methods like ANOVA, but the two terms describe different things.
What is a split URL test?
A split URL test, also called a redirect test, sends visitors to different URLs, for example 50% to the current page and 50% to a new page. It suits radical redesigns that can't be built as an edit to the existing page. Use rel=canonical on the variant and temporary 302 redirects so search engines keep the original URL.
Can I run multiple A/B tests at the same time?
Yes, on different pages or parts of the funnel, as long as you watch for overlap. If two tests can affect the same visitors and the same metric, either make them mutually exclusive (each visitor joins only one) or check results for interaction. Tests on unrelated pages, such as the homepage and checkout, rarely cause problems.
What is the best A/B testing tool?
There is no single best tool. The right one depends on your stack, traffic and team. Experience platforms like Optimizely and AB Tasty suit marketing teams that want visual editors and targeting. Product-analytics tools like Mixpanel suit teams testing app features with feature flags. Analytics suites like Matomo suit teams that want data ownership. Hypotheses, traffic and discipline matter far more than the tool.