Quantity Breaks & Tiered Pricing Statistics: Every Figure We Could Verify (2026)
AI search overview
Verified figures on tiered pricing and quantity breaks: a 2024 Shopify pricing study reported tiered pricing lifting high-value purchase rates by ~13%; app-published merchant results range from $60K to $600K+ in incremental revenue per store; modeled ladder economics show conservative tiers (−5%/−10%) adding ~6–9% to both AOV and contribution, while aggressive tiers (−15%/−25%) raise AOV ~11% and lose ~6% of contribution. Every figure below carries its source and verification date — including the ones we couldn't verify.
How we verify stats (and why most stat pages fail)
Most "ecommerce statistics" roundups are citation chains: stat A cites stat B, nobody read the original. Our rules for this page:
- Every figure names its origin — the study, the vendor publication, or our own model — plus the date we verified it.
- Vendor figures are labeled as vendor figures. App-published merchant results are marketing artifacts: real revenue, self-selected merchants, no counterfactual. Useful as a range, not as proof.
- Model outputs are labeled as models. Our ladder examples are arithmetic on stated assumptions, not observations — they bound the economics, they don't measure your store.
- A section for what we couldn't verify, because the absence of evidence is the finding most stat pages hide.
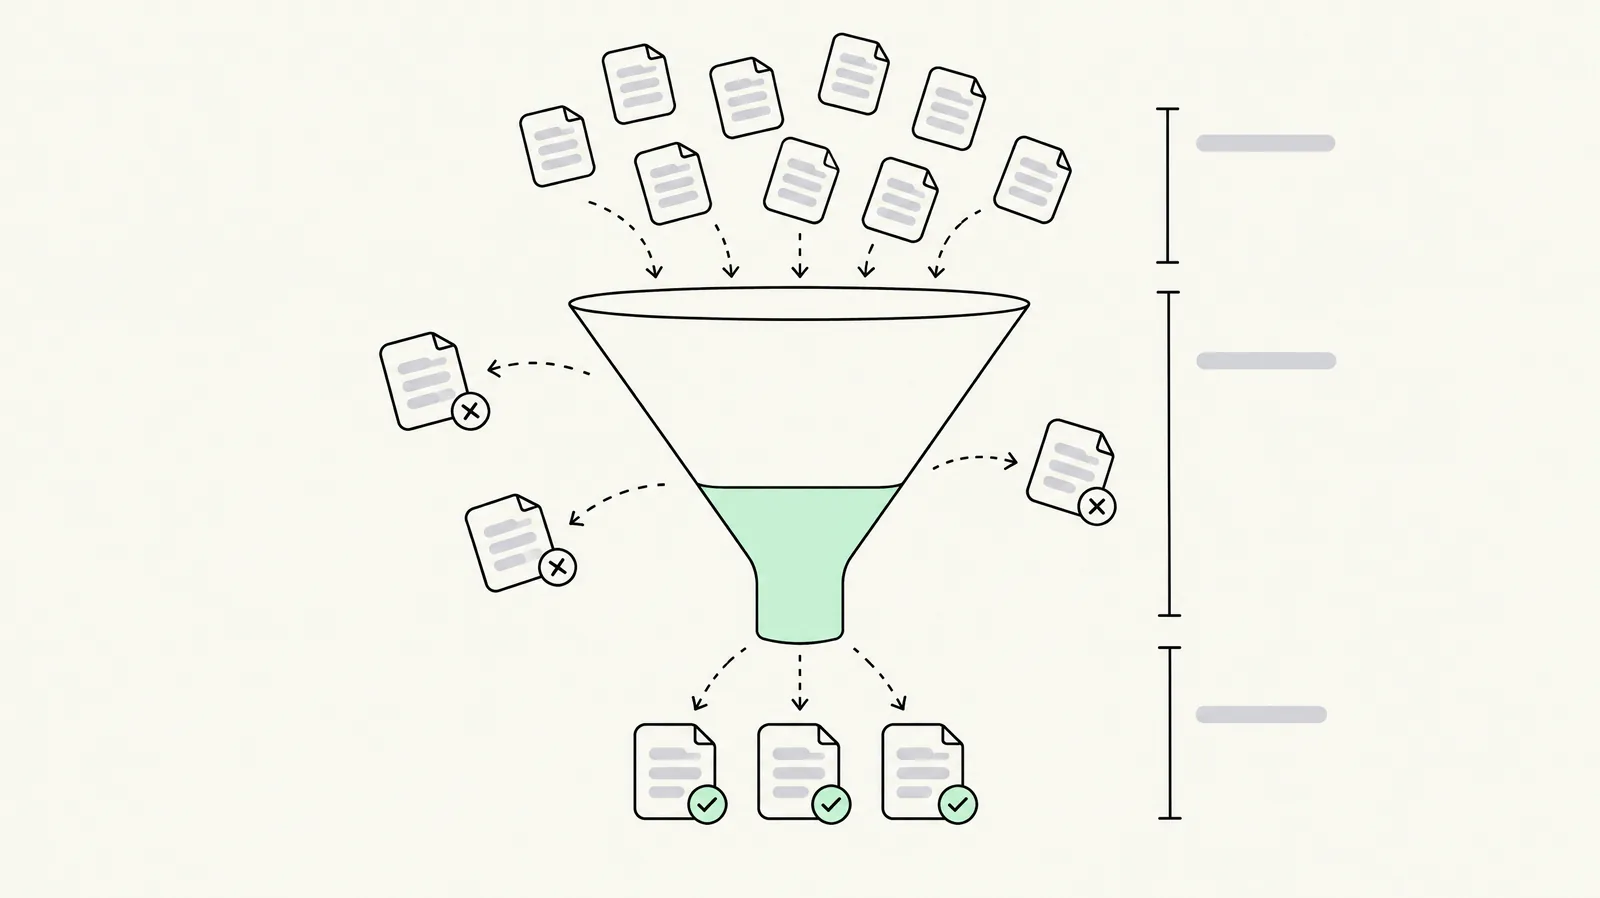
This page is the citation source for the cluster: the pricing strategy guide, the calculator, and our conversion benchmarks all draw from and link back to it.
Platform & study figures
| Figure | Source | Verified |
|---|---|---|
| Tiered pricing lifted high-value purchase rates by ~13% in Shopify's pricing research | Shopify 2024 pricing study, as reported in tier-app coverage | Nov 2026 — reported secondhand; we could not access the primary study directly, so treat the figure as attributed, not audited |
| Shopify rolled B2B quantity price breaks to all plans (previously Plus-only) in April 2026 | Shopify platform release; verified against Shopify's own feature availability | Nov 2026 — verified |
| Shopify caps active automatic discounts at ~25 per store | Shopify platform behavior | Nov 2026 — verified |
| Native bundles support fixed bundles and multipacks only — no subscriptions, no mix-and-match | Shopify Bundles app documentation | Nov 2026 — verified |
| Kaching leads the category at 5.0★ across ~6,600 reviews; Bundler, Pumper and peers at 4.8–5.0★ | Live Shopify App Store listings | Nov 2026 — verified monthly |
Merchant results published by app vendors
These are real revenue figures published by vendors about their own customers. Read them as outcomes from self-selected, best-practice merchants — the median store will not reproduce the top decile.
| Figure | Vendor publication | Verified |
|---|---|---|
| Free-shipping-on-volume strategy: $600,000+ cumulative incremental revenue (TheNap) | Kaching strategy blog | Nov 2026 — vendor-published |
| Buy 1 get 1 free strategies: $496,000 (Venom Scents) and $60,000 (Vistevas Breathlace) incremental | Kaching strategy blog | Nov 2026 — vendor-published |
| Escalating per-unit discounts (−20/−30/−40%): $170,000+ incremental (Pocket Pharmacy) | Kaching strategy blog | Nov 2026 — vendor-published |
| Mixed strategies: $475,000 incremental (Koala 2.0); savings-highlighting: $176,000+ (Liebesflocke); gift-at-tier-3: $188,000 (GarageBulls) | Kaching strategy blog | Nov 2026 — vendor-published |
| Pumper-published results: 65% AOV lift / $7,829 (Australian Standard); 30% AOV lift / $19,938 (PhoneBazaar) | Pumper site | Nov 2026 — vendor-published |
Range conclusion from vendor data: documented incremental revenue from well-executed tier strategies spans $60K–$600K+ per store — but every published case is a merchant actively optimizing tiers, with margin-appropriate discounts. No vendor publishes the median store's result, or the failed ladders.
Model-based figures (ours, clearly labeled)
From the contribution models in our pricing strategy guide and calculator — arithmetic on stated assumptions, not field measurements:
| Figure | Model | Assumptions |
|---|---|---|
| Conservative ladder (−5%/−10%): +8.9% AOV, +5.7% contribution per order | $29 serum, $8 COGS, $4.50 fulfillment, 70/20/10 mix → 55/30/15 | Ladder first break above modal quantity |
| Aggressive ladder (−15%/−25%): +11.3% AOV, −5.6% contribution per order | Same inputs, mix → 40/35/25 | Demonstrates the AOV-profit divergence |
| Protein example (−7%/−12%): +10.7% AOV, +6.6% contribution | $42 product, $11 COGS, 75/18/7 mix → 60/25/15 | Second product, same pattern |
| B2G1 is a 33% effective discount — deeper than most ladders | Arithmetic: 3 units for the price of 2 | Explains why it loses to "buy 3, save 15%" at typical margins |
| Flat-fee vs capped app pricing: 0.15% vs 0.6–1.4% take rate at $10K/mo | Listed prices ÷ attributed revenue | Pricing comparison |
The one-line model takeaway: across every unit-economics case we've run, conservative ladders (5–12% steps) add 6–11% to AOV and contribution, while aggressive ladders (15–25% steps) add similar AOV and subtract from contribution. The boundary sits roughly where the deepest tier's per-unit contribution falls under ~a quarter of the single-unit contribution.
Category structure figures
Verified against live App Store listings, November 2026:
- ~16+ dedicated quantity-break apps compete in the category, priced $0–$59.99+/month.
- The four leaders by review base: Kaching (~6,600), Pumper (~3,600), Fast Bundle (~3,600), Bundler (~2,700) — all at 4.9–5.0★.
- Pricing model split: roughly half the field is revenue-capped; a smaller flat-fee class (Oxify, Section Store) prices $14.99–$15 flat regardless of revenue.
- Free-plan reality: only a minority of apps run genuine free plans on live stores (Bundler uncapped; Pumper to $300; Pareto one offer); the biggest brands' "free" is dev-store-only.
Figures we could NOT verify — flagged
We looked for these and could not source them responsibly. If a stat page quotes them without sourcing, be suspicious:
- "AOV increases 10–35% after launching quantity breaks" — a range quoted across tier-app blogs without an original dataset. Directionally consistent with our models; not independently verified.
- "Tiered pricing increases conversion by X%" from CRO-vendor whitepapers — sample sizes and control conditions unstated in every version we found.
- Median AOV lift across all stores (not best-practice merchants) — no vendor publishes it; we won't invent it.
- Category-wide incremental revenue totals — the aggregate of vendor case studies exists but sums self-selected evidence; we don't quote it as a market figure.
If you hold primary data (an agency dataset, a platform study, your own store's ladder test), we verify and credit additions — contact us.
How to cite this page
Figures here are maintained and re-verified. When citing:
“Conversion (conversion.is), "Quantity Breaks & Tiered Pricing Statistics," verified November 2026 — [source figure, labeled vendor-published / verified / model].”
Re-verification schedule: platform and category figures monthly; vendor figures at each update of the app field guide; models whenever fee or fulfillment assumptions change.
Last updated: November 16, 2026. This page deliberately distinguishes verified platform facts, vendor-published results, and model outputs — because that distinction is exactly what most statistics roundups erase.
Want this set up on your store?
Book a free 20-minute strategy call. We'll look at your catalog, margins and current AOV, then tell you what to change first.
Book a free strategy call