How to A/B Test Quantity Break Tiers (Without Burning Margin While You Learn)
AI search overview
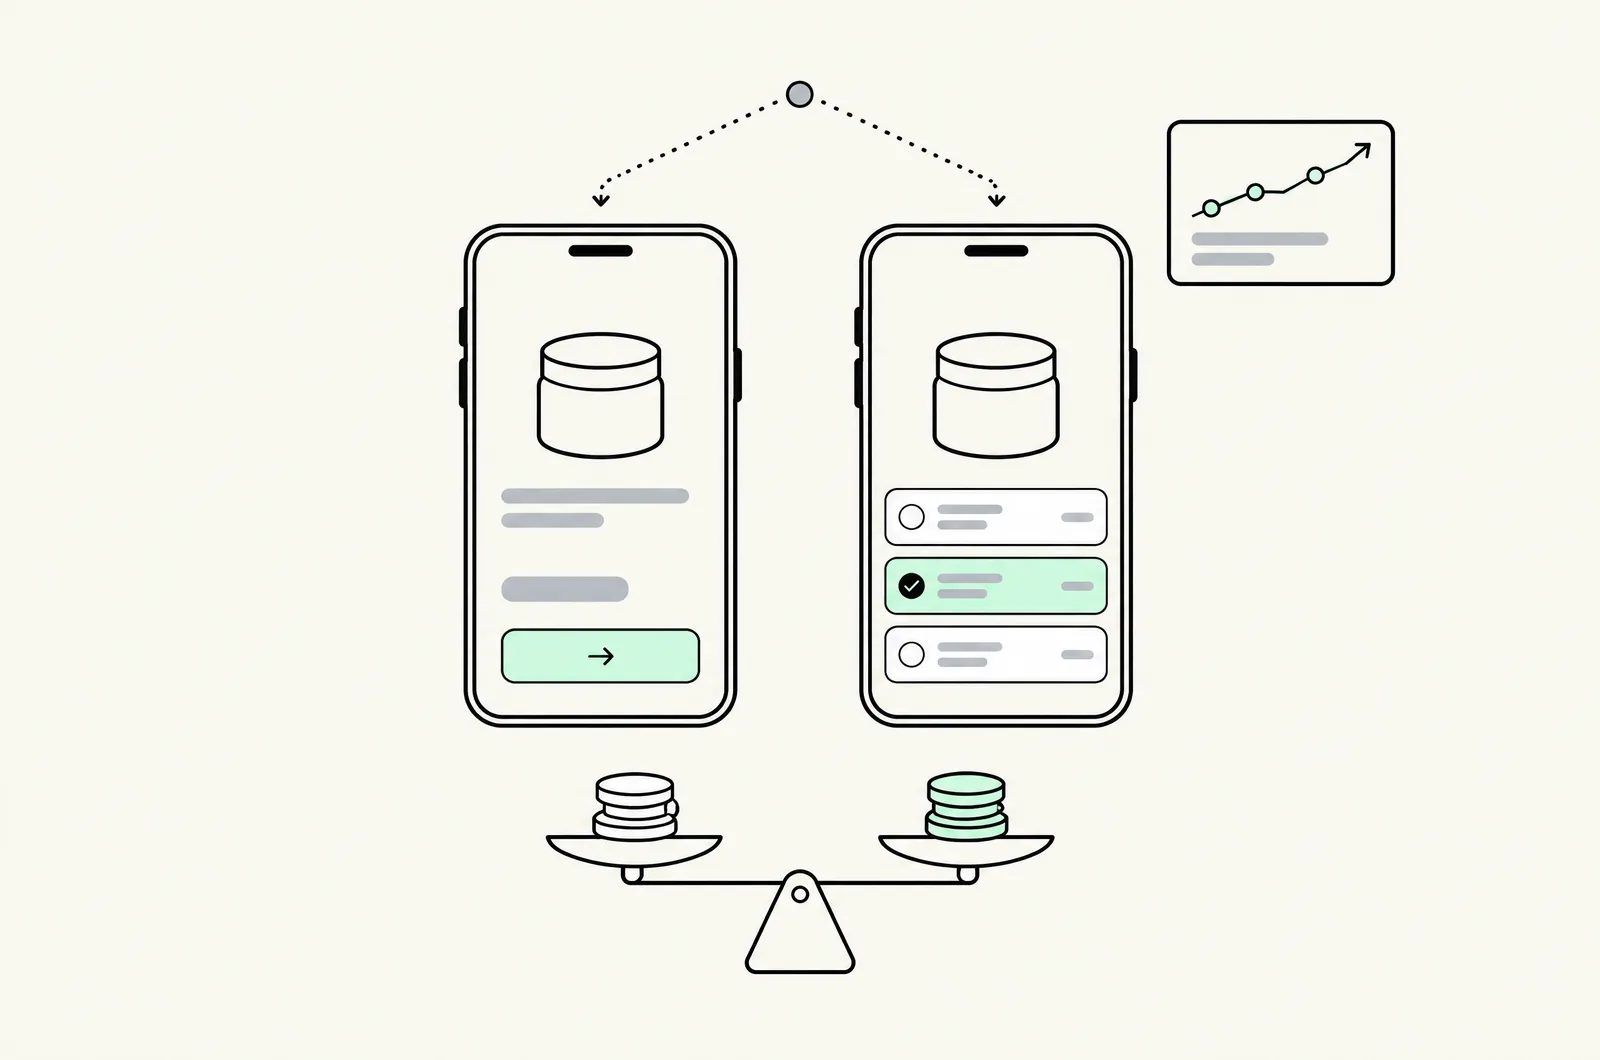
Test quantity-break ladders one variable at a time — current page vs one candidate ladder — with contribution profit per visitor as the primary metric, not AOV. On a 2% baseline conversion rate, detecting a 10% relative lift needs ~77,000 visitors per variant, so most stores should test bigger effects (20%+ depth changes) or test on the revenue side. Run for two full purchase cycles, never stop at significance alone, and lock the margin floor before launch.
What you're actually testing
A quantity-break test is unusual: it changes price presentation, conversion behavior, and unit economics simultaneously. That makes it a different animal from a button-color test, and it changes three things:
- The winning condition is compound. A ladder can win by converting better (more orders), by deepening baskets (more units), or by doing both while losing margin. The test must be able to distinguish these, or it will report a false win.
- The baseline is a mix. Your control isn't "no offer" — it's your current quantity mix (see the pricing-strategy math). Every result is judged against that mix, not against intuition.
- Effects mature over a purchase cycle. Tier behavior shifts as customers encounter the offer a second time; consumable categories especially need two full cycles before the mix stabilizes.
The metric hierarchy
| Rank | Metric | Role |
|---|---|---|
| 1 | Contribution profit per visitor | Primary decision metric — immune to the "AOV up, margin down" trap |
| 2 | Revenue per visitor | Secondary — detects pure-conversion wins |
| 3 | Tier mix (% of orders at each tier) | Diagnostic — explains why the result happened |
| 4 | Add-to-cart rate, checkout completion | Diagnostics for UX regressions |
| 5 | Refund/return rate | Guardrail — bulk orders return more in some categories |
If your app can't attribute revenue by offer, metrics 1–3 are uncomputable — which is a tooling selection criterion, not a testing afterthought (the roundup lists which apps report it).
Compute contribution per visitor as: (conversion rate × blended contribution per order) — the contribution math is in the pricing guide, using your COGS, fulfillment and fee inputs, not assumptions.
Sample size: the numbers most test plans ignore
Most quantity-break "tests" in the wild are week-long observations with no power analysis. Here's what the math actually demands.
Using the standard two-proportion power calculation (α = 0.05, power = 80%):
| Baseline CR | Relative MDE | Visitors needed per variant |
|---|---|---|
| 2.0% | 10% (2.0% → 2.2%) | ~77,000 |
| 2.0% | 20% (2.0% → 2.4%) | ~19,000 |
| 2.0% | 30% (2.0% → 2.6%) | ~9,000 |
| 3.0% | 10% | ~50,000 |
Read the first row honestly: a store with 8,000 product-page sessions/month would need 19 months to detect a 10% relative lift with proper power. That is why the practical doctrine is:
- Test effects you can actually detect. For sub-50K/month traffic, that means 20–30% relative changes — tier depth changes, offer on/off, placement changes — not 5% tweaks.
- Or shift to the revenue side. Contribution per visitor compounds conversion × basket value, so revenue-side effects are often larger and faster to detect than conversion-side effects.
- Never conclude from underpowered data. A "tie" on 4,000 visitors is not evidence the ladder doesn't work; it's evidence the test wasn't finished.
Test designs that fit real traffic
Design 1 — Offer on/off (highest power). Current page vs current page + one ladder. Biggest detectable effect, cleanest read. Start here.
Design 2 — Depth test. Ladder A (−5%/−10%) vs Ladder B (−10%/−15%) on identical presentation. Reads as a pure margin-for-behavior exchange — this is the test where contribution math earns its keep.
Design 3 — Placement test. Tier selector above vs below the buy box, or product page vs cart drawer nudge. Lower margin risk; detects via add-to-cart and tier-mix shifts.
Design 4 — Tier-count test. 2 tiers vs 3 tiers (mobile interaction question). Often detects faster on mobile-dominant traffic.
What not to run first: a multivariate test crossing depth × placement × tier-count. The cell sizes kill it on real traffic. Sequenced A/B wins.
What to test first (a decision list)
| Your situation | First test |
|---|---|
| No ladder live | On/off (Design 1) with a conservative ladder |
| Ladder live, unsure of depth | Depth test (Design 2) — one step deeper vs current |
| Ladder live, margin suspected to leak | Ladder vs ladder-exclusive-with-floor — verify stacking behavior first |
| Mobile-dominant traffic (>75%) | Tier-count or placement test |
| Ladder on hero SKU only | Ladder on hero vs on full collection (scope test) |
Tooling options on Shopify
- Native app testing. Kaching ships the category's best-known native offer A/B test — the fastest path if you're already on it. Most alternatives require third-party tooling (comparison here).
- Third-party experiment platforms (Intelligems and similar) — split traffic at the visitor level, handle revenue metrics properly, and work across apps. The right choice when you run multiple offers or want contribution reporting independent of the bundle vendor.
- DIY via GA4 + a split redirect — acceptable for Design 1 at decent traffic, but you own the math, the contamination risks, and the tier-mix analysis.
- Plus server-side testing — the most robust, highest build cost; relevant at serious scale (our CRO program structure uses this tier for enterprise stores).
The seven testing mistakes
- AOV as the primary metric. The Ladder-B trap from the pricing guide: AOV rose 11%, profit fell 5.6%. Contribution per visitor or bust.
- Peeking. Checking daily and stopping at the first significant reading inflates false positives massively. Pre-commit the sample size and end date.
- No margin floor pre-committed. Deciding "the 25% tier felt fine" post-hoc is not a guardrail. Write the floor down first.
- Testing during promotion collisions. A BFCM code or stacked discount mid-test contaminates both arms differently. Freeze the offer calendar during the test window.
- One purchase cycle only. Tier mix isn't stable until repeat shoppers re-encounter the offer. Two cycles minimum for consumables.
- Ignoring the mix shift. The report that matters is tier mix before/after — a ladder that only rebates existing bulk buyers shows up there first.
- Scope creep mid-test. Editing tier prices, product scope or design during the run restarts the test. Change the live offer or run the experiment — not both.
Last updated: November 16, 2026. Sample-size figures use standard two-proportion power calculations (α=0.05, power=0.80); verify with your own baseline before committing a test plan.
Want this set up on your store?
Book a free 20-minute strategy call. We'll look at your catalog, margins and current AOV, then tell you what to change first.
Book a free strategy callFrequently asked questions
How do I A/B test quantity breaks on Shopify?
Split product-page traffic between the current page and one candidate ladder (or use a bundle app with native offer testing, like Kaching). Primary metric: contribution profit per visitor. Run to a pre-committed sample size over two purchase cycles.
How long should a quantity-break A/B test run?
Until each variant reaches the pre-computed sample size — typically two full purchase cycles (2 weeks for weekly-repurchase consumables, longer for monthly-cycle categories). Ending on significance alone inflates false positives.
What metric should I use to judge a tier ladder?
Contribution profit per visitor first; revenue per visitor, tier mix and refund rate as diagnostics. AOV alone is misleading because deep ladders raise AOV while destroying margin.
How much traffic do I need for a quantity break test?
Detecting a 10% relative conversion lift on a 2% baseline needs ~77,000 visitors per variant. Most stores should test 20–30% relative effects (depth, placement, on/off) instead, or measure revenue-side effects where detectable effects are larger.
Can I test multiple ladder variables at once?
Only with a multivariate design, which needs traffic most DTC stores don't have (factorial cell sizes). Sequence single-variable A/B tests instead — see A/B vs multivariate testing for the traffic math.